From Fields to Forecasts: How Space-Age Tech is Revolutionizing Agricultures
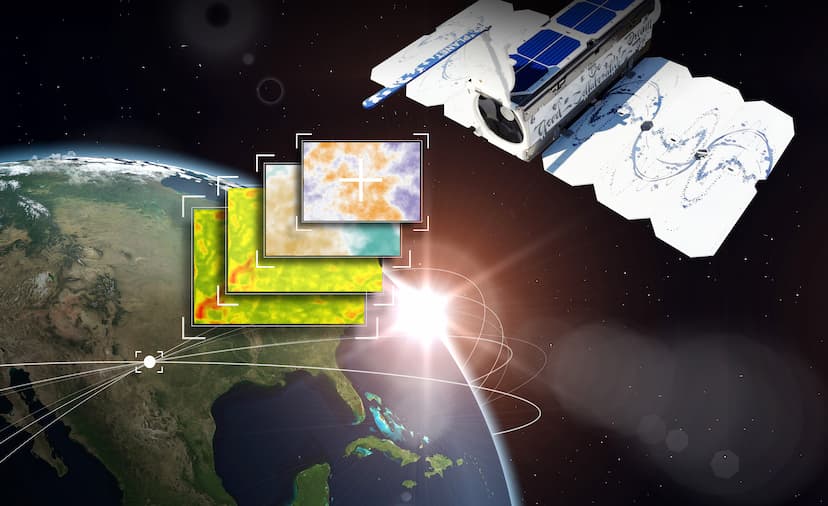
Today, farmers are boosting crop yields by up to 15% thanks to the power of satellites. Imagine having detailed maps that reveal stress zones and optimize irrigation down to the square meter. This data-driven approach isn’t just saving water (up to 20%), it’s paving the way for sustainable agriculture. With hyper-accurate weather forecasts, AI-powered pest detection, and real-time yield predictions, satellite technology is propelling us into the future. The future of farming is data-driven, and satellites are leading the charge. Are you ready to join the revolution?
Sky-High Yields: Your Crops from Space
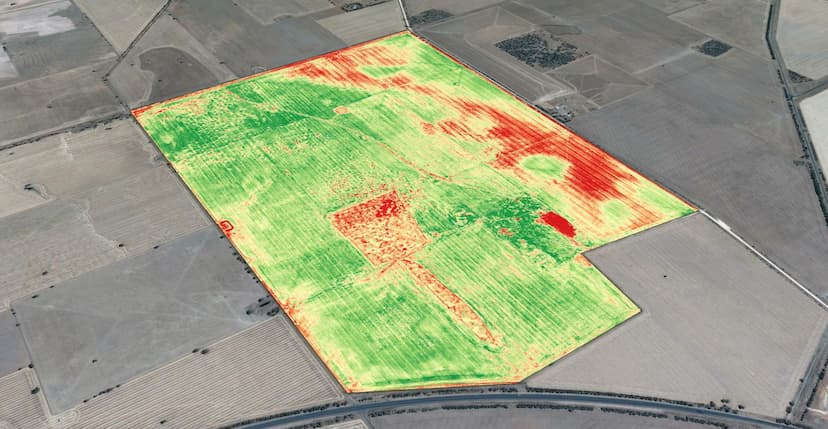
Today, farmers are boosting crop yields by up to 15% thanks to the power of satellites. Imagine having detailed maps that reveal stress zones and optimize irrigation down to the square meter. This data-driven approach isn’t just saving water (up to 20%), it’s paving the way for sustainable agriculture. With hyper-accurate weather forecasts, AI-powered pest detection, and real-time yield predictions, satellite technology is propelling us into the future. The future of farming is data-driven, and satellites are leading the charge. Are you ready to join the revolution?
Ready to delve deeper? Let’s explore powerful tools known as satellite indices. These indices act like fingerprints, analyzing data captured from space to unlock valuable insights about your crops’ health and performance. Here are some of the most popular ones:
NDVI: Unveiling the Green Truth of Your Fields
Ever wished you could see beyond the surface of your crops, peering into their health and vitality? Meet the Normalized Difference Vegetation Index (NDVI), your window into the hidden world of plant life. This satellite-derived index acts as a vegetation health meter, revealing valuable insights to guide your farming decisions.
The NDRE formula:
- NIR (Near-Infrared): Reflected strongly by healthy vegetation.
- Red: Absorbed by chlorophyll, the green pigment vital for plant health.
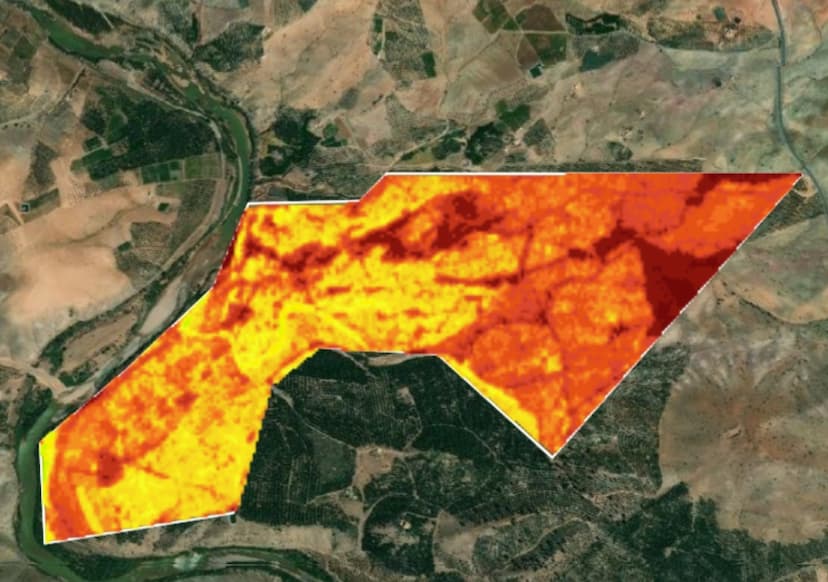
The higher the NDVI, the healthier and denser your crops. Values range from -1 to 1:
- -1 to 0: Bare soil, water, or stressed crops
- 0.2 - 0.6: Moderate vegetation cover
- 0.6 - 1: Dense and healthy vegetation
Use NDVI to:
- Spot early signs of stress (water, nutrients, disease)
- Optimize irrigation and fertilizer use
- Track crop growth and predict yields
- Make data-driven decisions for better harvests!
NDRE: Your Early Warning System for Crop Health
The Normalized Difference Red Edge Index (NDRE) is a powerful tool for measuring the chlorophyll content in plants. It uses a combination of a Near-InfraRed (NIR) band and the RedEdge range between visible Red and NIR.
The NDRE formula:
- NIR (Near-Infrared): Reflected strongly by healthy vegetation.
- Red: Absorbed by chlorophyll, the green pigment vital for plant health.
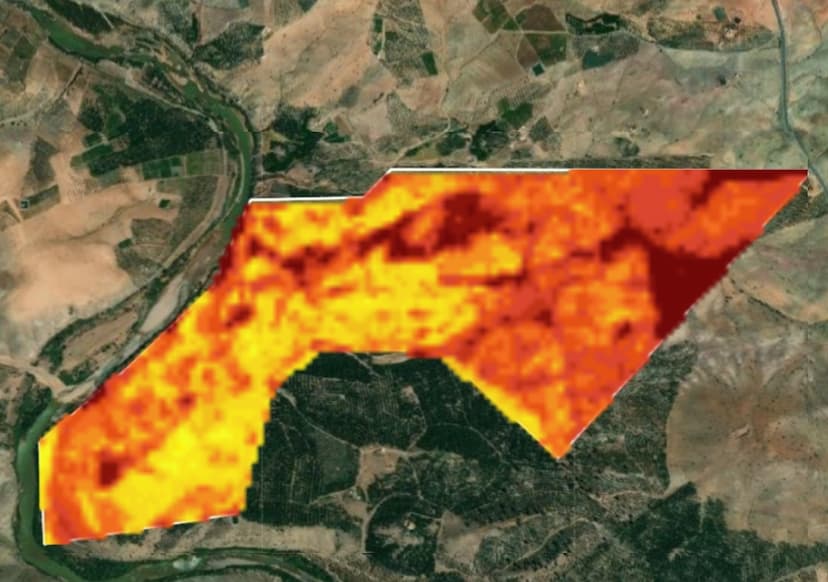
- -1 to 0: Bare soil, water, or stressed crops
- 0.2 - 0.6: Moderate vegetation cover
- 0.6 - 1: Dense and healthy vegetation
Use NDVI to:
- Spot early signs of stress (water, nutrients, disease)
- Optimize irrigation and fertilizer use
- Track crop growth and predict yields
- Make data-driven decisions for better harvests!
NDMI: Your Guide to Moisture Levels in Crops
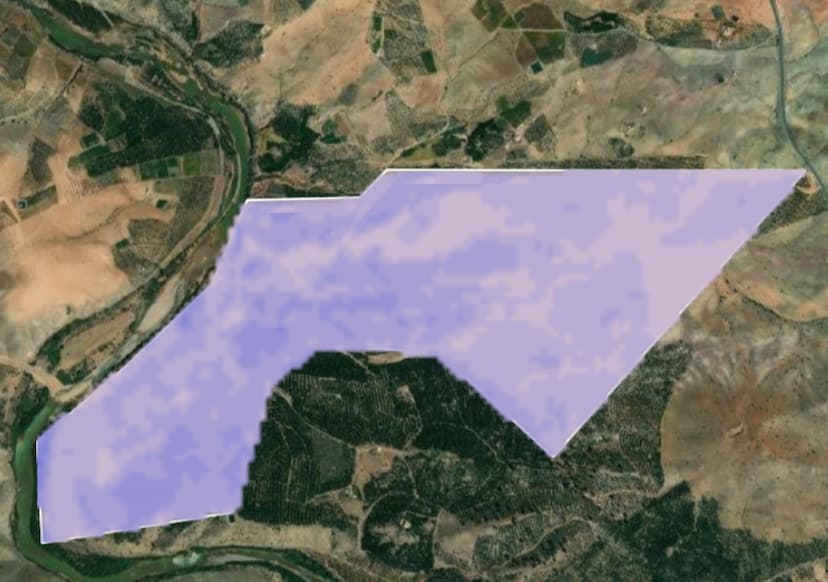
The Normalized Difference Moisture Index (NDMI) is a reliable indicator of water stress in crops. It detects moisture levels in vegetation using a combination of near-infrared (NIR) and short-wave infrared (SWIR) spectral bands.
The NDMI formula:
- NIR (Near-Infrared): Reflected strongly by healthy vegetation.
- Red: Absorbed by chlorophyll, the green pigment vital for plant health.
- -1 to 0: Bare soil, water, or stressed crops
- 0.2 - 0.6: Moderate vegetation cover
- 0.6 - 1: Dense and healthy vegetation
Use NDVI to:
- Spot early signs of stress (water, nutrients, disease)
- Optimize irrigation and fertilizer use
- Track crop growth and predict yields
- Make data-driven decisions for better harvests!
MSAVI: Monitoring Early Crop Health
The Modified Soil Adjusted Vegetation Index (MSAVI) works best during seed germination and leaf development stages. It reduces the effect of the soil on the calculation of vegetation density in the field.
The MSAVI formula is:
- NIR (Near-Infrared): Reflected strongly by healthy vegetation.
- Red: Absorbed by chlorophyll, the green pigment vital for plant health.
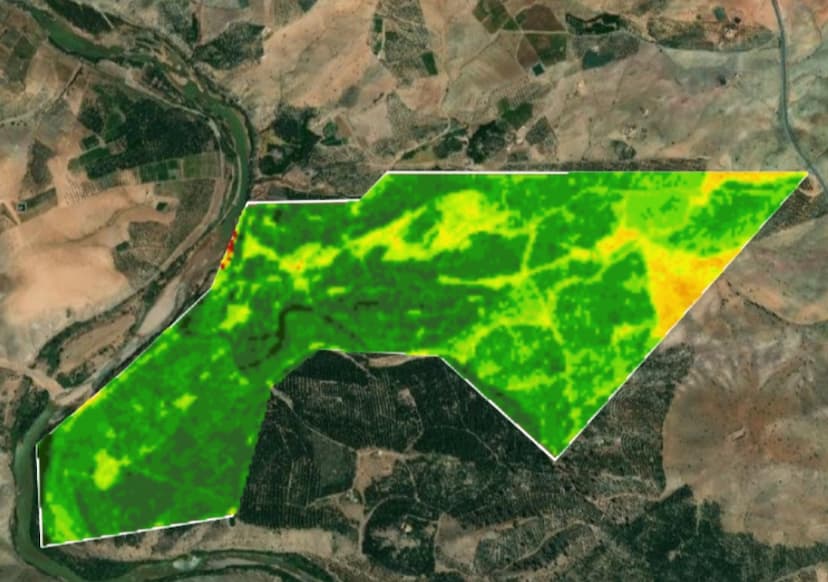
MSAVI values range from -1 to 1, where:
- -1 to 0: Bare soil, water, or stressed crops
- 0.2 - 0.6: Moderate vegetation cover
- 0.6 - 1: Dense and healthy vegetation
Use NDVI to:
- Spot early signs of stress (water, nutrients, disease)
- Optimize irrigation and fertilizer use
- Track crop growth and predict yields
- Make data-driven decisions for better harvests!
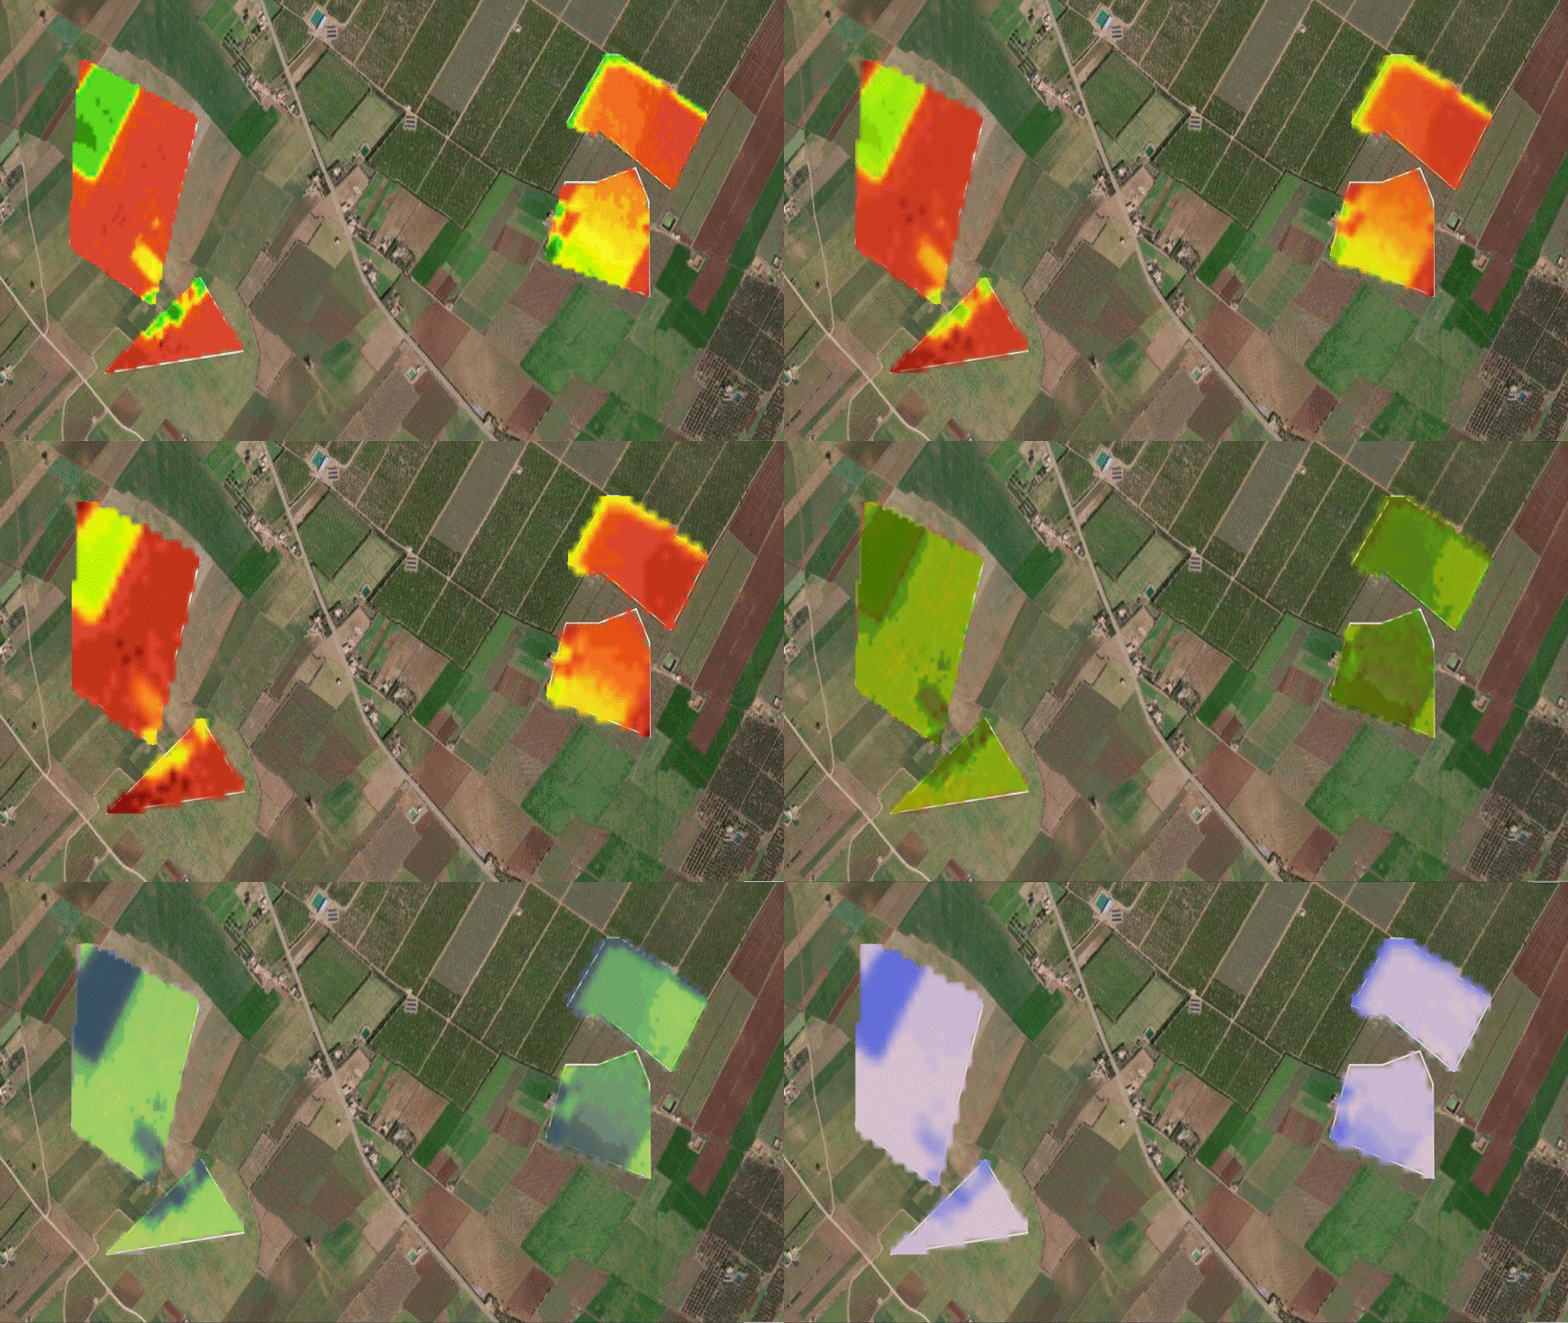
FILAHI is more than just data, it's your partner in maximizing crop health and yield.
Conclusion
Embark on a new agricultural journey with FILAHI’s premium satellite offer. This essential solution empowers farmers to refine their practices and optimize yields. Leveraging real-time data, this revolutionary service enables precise resource use, waste minimization, and profitability enhancement. This technological leap signifies a major shift towards precision agriculture and sustainability. Embrace the future by adopting these innovative tools, and witness the growing trend among farmers in the years to come. By investing in FILAHI’s top-tier satellite offer, farmers not only gain a competitive edge but also actively contribute to shaping a more sustainable future for agriculture.